

The AttributeError: module ‘matplotlib’ has no attribute ‘plot’ is a common error faced while working with data visualization in Python. If you are new to data visualization, learning the matplotlib module in Python is necessary. Matplotlib is a comprehensive Python library in Python for creating static, animated, and interactive visualizations in Python. It uses Python’s numerical extension numpy for plotting and statistics.
In this article, we will cover the different reasons this error may occur and different ways to resolve the error with code demonstrations.
Contents
What is the AttributeError: module ‘matplotlib’ has no attribute ‘plot’ error?
There are usually three reasons for getting this error using the matplotlib library in Python.
Matplotlib was not installed or loaded correctly
One of the main reasons for this error is that the Matplotlib module has not been installed in your system. You must activate the virtual environment before installing the Matplotlib module using a Python virtual environment. To check if you have installed the matplotlib module correctly, execute the given lines of code:
import matplotlib
print(matplotlib.__version__)
As per the above code, if the matplotlib package is installed correctly in your system or virtual environment, the package’s version number will be printed in the output code. Or else you will get the error ImportError: No module named matplotlib.
Improperly importing the matplotlib module
The second reason you get the error AttributeError: module ‘matplotlib’ has no attribute ‘plot’ is that you import the matplotlib module incorrectly. For example, pay close attention to the below-given example below:
import matplotlib as plt
import numpy as np

x = np.linspace(-20 , 20, 300)
y = np.sin(x)
plt.plot(x, y)
plt.show()
This code will give us the error AttributeError: module ‘matplotlib’ has no attribute ‘plot’. In line 1 of the code, the matplotlib module was incorrectly imported, hence the error.
Incomplete syntax when plotting the graph
If you have your package installed and imported the module correctly and are still getting the error, then the reason might be incorrect syntax in the code. For example, look at the below-given code:
import matplotlib as plt
import numpy as np

x = np.linspace(-20 , 20, 300)
y = np.sin(x)
plt.plot(x, y)
plt.show()
This code will give you the AttributeError: module ‘matplotlib’ has no attribute ‘plot’ error because the code is incomplete.
How do you resolve AttributeError: module ‘matplotlib’ has no attribute ‘plot’ Error?
We will resolve all three cases where you may get the error individually below. So here are the given solutions.
Matplotlib was not installed or loaded correctly.
To install the matplotlib package globally or system-wide, enter the following command into your terminal
#for Python version 2 and below
pip install matplotlib
#for Python version 3 and above
pip3 install matplotlibIf you have to install the package in a virtual environment, make sure you have enabled the virtual environment. First, make sure you are inside the virtual environment directory, and then execute the following command in the terminal:
source /bin/activateIf you get an error such as source: no such file or directory: /bin/activate, you are not in the correct directory as the virtual environment folder.
Improperly importing matplotlib module.
In the problem code, line 1 was highlighted as the problem line. So, if you have made the same mistake as the code shown above, here is the solution:
import matplotlib.pyplot as plt
import numpy as np

x = np.linspace(-20 , 20, 300)
y = np.sin(x)
plt.plot(x, y)
plt.show()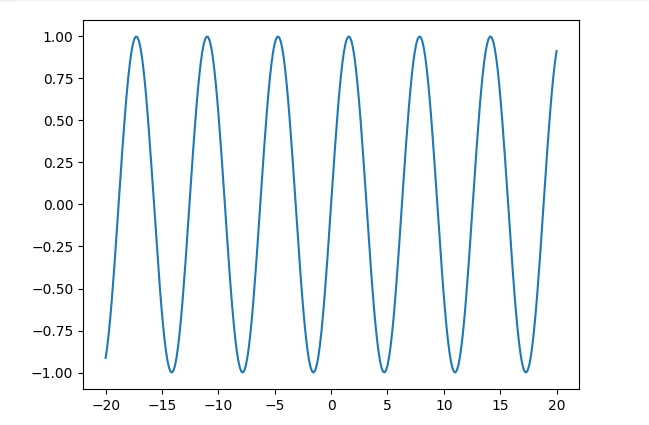
The correct method is to import matplotlib.pyplot and not just matplotlib. Pyplot is the unified interface of the matplotlib library that allows you to utilize the plotting functions. Importing it the correct way is hence very necessary.
Incomplete syntax when plotting the graph
Regarding the 3 buggy codes, the error AttributeError: module ‘matplotlib’ has no attribute ‘plot’, which occurred because the code was incomplete. Here is the correct, complete code for the same given below:
import matplotlib.pyplot as plt
import numpy as np

x = np.linspace(-20, 20, 300)
y = np.sin(x)
plt.plot(x, y)
The plt.show() line is important for the plotting to create the desired plot in the output. Without it, the code will give us errors or end execution without output.
FAQs
How do you correctly import the matplotlib module?
Only writing import matplotlib as plt is the incorrect import method. The correct way to import matplotlib is to import matplotlib.pyplot as plt
How do I resolve pip errors when trying to install the matplotlib module?
Make sure your pip command corresponds correctly with the Python version you are using. If your Python is version 3 and above, use pip3 to install modules and not just write pip. Otherwise, check if your pip is correctly installed by typing the pip –version in the terminal. If you get an error output, you have to install or reinstall the pip.
How do we check the version of a Python package?
To check the version of any Python package, use the code print(package_name.__version__). Replace package_name with the name of the desired package you wish to check the version of. The output will tell you the package version and its availability on your system or virtual environment.
Conclusion
Matplotlib is not just the first data visualization package on Python you learn, but the most important one as it is used in data science and scientific programming in Python.
However, while learning, you may run into errors such as `AttributeError: module ‘matplotlib’ has no attribute ‘plot’, which usually arises from 3 different cases. It is either a problem with the package not existing in the user’s system, an incorrect import, or incomplete code syntax. These three errors can be easily resolved in a few lines, as shown in the above article.
We hope this article has helped you understand and fix the error in your Python code. Happy coding!
Reference
To learn more about some common errors follow Python Clear’s errors section.
